My Thoughts on “Dashboards Are Dead: 3 Years Later”
Disclaimer: Excluding the TL;DR section, this article was written without any assistance from LLMs such as ChatGPT. While ChatGPT will probably write a better article than I do, my motivation is to express some candid thoughts and share my experiences. Writing this took way longer than it should have, but it’s always a nice feeling to pen down my reflections and have a finished product to show.
TL;DR (with the help of ChatGPT 🤖)
Responding to a Medium article that I chanced upon, I discuss the evolving role of dashboards in data teams. While dashboards are not dying, the focus has shifted towards delivering information in the best way possible. Drawing from my personal experiences interning at fintech and e-commerce companies, I share insights on the varying needs for data presentation and the challenges faced in managing dashboards. I also explore the potential impact of AI on data teams and suggest that embracing AI can enhance workflows and create new opportunities for data practitioners. I conclude by expressing optimism about the future of technology roles and the value we can find in working with AI.
Summary of the original Medium article by Taylor Brownlow
Taylor Brownlow, a data advocate, argues that dashboards are dying (not dead), not because of anything wrong with dashboards, but rather with everything around them, such as relationships, communication, processes, and people. With a rapidly growing offering of data-provisioning alternatives, data teams have been moving away from “how to make this dashboard great” towards “what’s the best way to deliver this information?” Brownlow shares three persistent problems data teams need to solve to make that leap forward.
First, data teams have been quick to integrate modern data pipelines and environments into the technical stack, but they have yet to figure out how to leverage that innovation to deliver greater value to stakeholders. Next, data teams must learn to build trust (internally and externally) not just through reliability and accuracy but also through communication and creating a safe space for mistakes. Finally, data teams should consider adopting tools that prioritize collaboration, data transparency, and experimental flexibility.
Overall, Brownlow is optimistic about the nascent changes happening in the data industry.
Drawing Parallels with Personal Experience
I’ve had the privilege of interning at two exceptional data teams operating in different spaces, one in fintech (Funding Societies) and the other in e-commerce (Shopee). Each team was solving a different set of problems using different methods, but both had a common goal of delivering reliable data and quality insights to drive decision-making.
My First Foray into Data
I did my very first internship at Funding Societies (FS), a regional fintech startup, in the summer of 2021. It was an amazing experience learning how the data team (comprising engineers, scientists, and analysts) functioned as one cohesive unit. Unlike regular internships where you are usually assigned an intern project, I wore many hats at FS. I dug through thousands of lines of SQL to resolve production bugs, collaborated with business teams based in Singapore, Jakarta, and Kuala Lumpur on auditing and product releases, and built/refactored dozens of dashboards, among other tasks.
I soon realized that not everyone needs a dashboard. Some stakeholders simply needed an Excel dump to run their analysis, while others wanted actionable insights and were flexible with the presentation style. In the long run, the data team wanted stakeholders to self-serve data for ad-hoc requests and gradually grant data ownership to external team leads. For that, we looked to Atlan which provided a data catalog of the hundreds of table columns in our Snowflake data warehouse as well as an interface to run simple queries. I worked closely with my manager to populate our catalog, onboard new users, and gather feedback.
I left FS before the decision was made whether to integrate Atlan. We had doubts about the reliability and usability of the service (Atlan was only two years old then) so I’m not sure if we did manage to figure something out. Looking back, tools like Atlan would have helped push our agenda toward collaboration, data transparency, and experimental flexibility (advocated by Brownlow). Even though the data team at FS was lean and young, we embodied a forward-looking approach to managing data.
New Team, Similar Role
I joined Shopee in the summer of 2022, when it had recently overhauled its Business Intelligence division into separate data teams that were assigned to various core groups. For context, Shopee is a mature listed company with ~$19B valuation as of writing. In the Search and Recommendation (SnR) team, analysts worked closely with product managers who were either driving new features or exploring user segmentation. Because each feature release required extensive A/B testing and validation, most of our work was comprised of analyzing and drawing conclusions from user behavior. Dashboards were surprisingly not the main medium of data presentation. Instead, we mostly relied on Google Sheets for the job. Doing so allowed us to iterate quickly and match the pace of the product development lifecycle.
Dashboards Saved The Day
Two things stood out to me during my time at Shopee.
First, analysts sometimes faced long query times (between 30 minutes and an hour). Granted, we were querying against terabytes (sometimes petabytes) of data, but our data infrastructure should have been robust enough to handle it. We implemented comprehensive data marts and adopted tools like Presto and Spark to power big data analytics. So, why were processing times still unbearably long? The root cause, I later learned, was that our ML engineers were also running their experiments. If you know anything about training models, it is that it takes up a ton of resources. And those resources were shared among the entire SnR team.
Okay, so why not just scale horizontally by buying up machines? Recall that Q3 2022 was a hot mess for tech companies, and Shopee wasn’t an exception. Because of long wait times, if I ran a query in the Web UI, I couldn’t lock my computer or put it to sleep. Else, I risked losing all progress that the query has made. The workaround? Deploy queries as jobs on the cloud and pipe the output into Google Sheets.
For less important (but still large) queries, it didn’t make sense to go through all the trouble of deployment. There were “prime” periods throughout the day to run queries, and I knew this from… you guessed it: a dashboard. It was embedded in the server-monitoring internal tool. When the load was low, queries that would have run in 10 minutes ran in just a few seconds. Those real-time metrics were also crucial for validating performance improvements when I experimented on optimizing Spark parameters for batch jobs. Feel free to read my article about tuning Spark if you are interested.
Second, dashboard management was disorganized. We used Redash for most of our dashboards. Unlike at FS, the data team at Shopee SnR usually reports to PMs in the same team. Perhaps because of this, rules around data organization were not very strict. Redash is a great open-source tool with pretty much all the features you would want to build a great dashboard. The downside, however, is finding past dashboards quickly. You could only rely on the search bar to locate dashboards by name or tags. There was no directory or repository to group dashboards. To make matters worse, dashboards made by developers for monitoring experiments as well as draft(!!) dashboards were floating around the platform, all of which were of no use to us analysts.
To alleviate this pain, I created an index dashboard that references all the other dashboards made by the analysts. We would group them by SnR domains and include existing filters. You might argue that it could have been done in Sheets, but I am adamant that the index dashboard is the most appropriate solution. Using Redash, we ended up with a neat UI that would encourage users to update it regularly. The dashboard also became the landing page for analysts and PMs who wished to quickly retrieve multiple related dashboards. Personally, it saved a LOT of time and clicks. So yea, sometimes throwing a dashboard at the problem works.
One Door Closes, Another Opens
Three months flew by, and it was time to go. I gave this gig my all and was pleased with my contributions. More importantly, this internship taught me so much about product and engineering at a large tech company. Intrigued by how systems scale and perform in the context of big data, I was drawn to explore deeper into the technical aspects of data processing and management. And so I took a leap of faith and delved into academic research in Data and Systems. I eventually joined the Data intensive Systems and Computing (DiSC) Lab at BU. I wrote a brief introduction to Log-Structured Merge-Tree — the underlying data structure of modern key-value data stores which the lab is researching on. The article can be found here.
Are Dashboards Dying?
The data teams I have been a part of had a healthy understanding of the limitations of dashboards and only utilized them when necessary. Personally, I still believe dashboards are here to stay for a few reasons:
- Infrastructure teams heavily rely on dashboards to monitor production services
- Dashboards tell a story bluntly but elegantly
- Dashboards help keep a large group of stakeholders in sync and direct them on the right course of action
- Most companies are still very comfortable incorporating dashboards in their reports/presentations and it will take a lot of effort to convince them otherwise
The Other Monumental Shift in Data
Since everyone is talking about AI these days, I figured to include a section on it. Here is how AI might be a threat to data teams:
- While analysts are the storytellers and influencers of decision-making, generative AI might be able to provide a more unbiased, concise, and accurate depiction of the data. This will remove the need for data self-serve through mediums like dashboards and for analysts to come up with these insights organically
- AI can help with data cleaning, and create and run experiments such as A/B testing, all of which represents the bulk of work for data scientists
To remain robust, data scientists and analysts should not fear such colossal tech advancements but instead, learn to adopt them into their current workflow.
- Data scientists and analysts could potentially cross over to research and engineering roles
- Data practitioners could become the architects who design frameworks for data presentation and data delivery that will be built and run by AI
The possibilities for integrating workflows with AI are endless. With that, I foresee the future of technology roles model this life cycle:
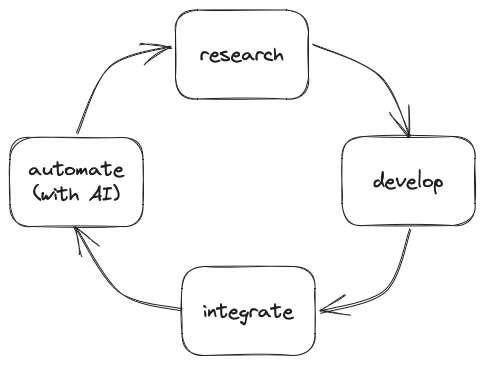
This is nothing new. Tech companies with a research arm are probably implementing something similar. What I’m implying is that this cycle will be increasingly adopted across tech teams and accelerated within teams that already use this. To quote the writer William Gibson, “The future is already here – it’s just not evenly distributed.”
Closing Thoughts
Computing’s core tenet has always been automation. Pivotal inventions in the early days include the Turing-Welchman Decoder and Grace Hopper’s Compiler. Computing aims to replace the mundane and allows us to channel our energy toward more meaningful pursuits. While AI has already begun to challenge us aggressively in the creative space, I am confident that we will soon discover new areas of value in working with technology, like we always have. After all, AI is just another one of our inventions. Thanks for reading :)
Suggested Reading
Dear data practitioner: Have you gone outside your data bubble?
How to Build an Analytics Front End that Doesn’t Suck: Presentation-Purpose Fit